Back Office: Inventory Reports
Navigation: Log into the Back Office and select a Store. On the left side, select Reports > Inventory Reports.
On the Inventory Reports dashboard, select a tab:
Master Stock
Purchased Item
Consumption Log
Compare Inventory
Count Sheet
COGS
Adjust Inventory
Inventory Item History
Matrix Report
Wastage Report
Master Stock
High-level
details about the Store's item inventory. Select from the following along with Time Period,
then click Apply.
- TYPE: Select Inventory Item or Retail Item – or ALL (both). Selecting Inventory will make the Inventory Items dropdown appear, and the same with Retail and Retail Items.
- CATEGORY: Select a Category (from set established in Back Office), or ALL categories - with Search option to identify a category more quickly.
- SUB CATEGORY: Select a Sub Category (based on selected Category, from set established in Back Office) - with Search option to identify a sub category more quickly.
- INVENTORY ITEMS / RETAIL ITEMS: Displays the dropdown based on your Type selection. If ALL was selected, neither of these additional dropdowns appear.
- TRANSACTION TYPE: Select the transaction type for inventory items. For Transfer In, Adjusted Increase and Purchase, the Quantity column is denoted as a positive value - and for Transfer Out, Sale, Adjusted Decrease, and Consumption Inventory, the Quantity column is denoted as a negative value. Also, the Value on Hand / Quantity and Price Per Unit are displayed based on the Transaction Type calculation.
When Apply is clicked, the below table containing the following columns is populated:
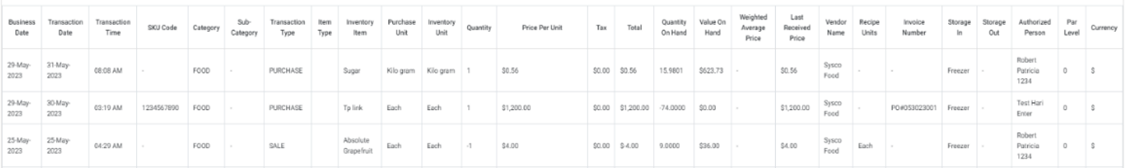
- Business Date: The business date of purchase/sale/transfer in/transfer out/consumption inventory
- Transaction Date: The date of purchase/sale/transfer in/transfer out/consumption inventory
- Transaction Time: The time of purchase/sale/transfer in/transfer out/consumption inventory
- SKU Code: The unique code set when creating the Inventory Item (not a mandatory field)
- Category: The Category the Item was added under when created in Back Office (BO).
- Sub Category: The Sub Category the Item was added under when creating in BO.
- Transaction Type: The type of transaction (same options as the above dropdown).
- Inventory Item: This name of the Inventory Item.
- Purchase Unit: The purchase unit which is chosen for inventory item.
- Inventory Unit: The unit measure of the of the Inventory Item.
- Quantity: The quantity used in Transaction Type.
- Price Per Unit:
- If Weighted Average Price was chosen in inventory settings, this column displays the last Weighted Average Price Per Unit.
- If Last Price was chosen, this column displays the latest received Price Per Unit.
- Total: The Total Amount – excluding any Tax Amount (Quantity * Price Per Unit).
- Quantity on Hand: The Store's quantity on hand.
- Value on Hand: The total value of the on-hand product (Quantity on Hand x Value on Hand).
- Weighted Avg Price: The weighted average price of the inventory item (if applicable)
- Note: If Last Price was chosen in Inventory Settings, this column’s values will appear as NA or 0.00.
- Last Received Price: The price of the most recently received item (at time of Received Log Price).
- Vendor Name: The name of the vendor.
- Recipe Units: The item's unit of measure.
- Invoice Number: The Invoice Number (applicable to the sale).
- Store / Storage In: The Primary Storage (at the time of purchase).
- Store / Storage Out: The Secondary Storage (to which storage it reaches).
- Authorized Person: The username of the authorized individual (based on the activity log).
- Par Level: The minimum stock quantity of the Item.
- Currency: The symbol representing the currency used for the Transaction.
Purchased Item
High-level
details about the Store's purchased items.
- Select a Type (then additional dropdown options based on selections) and Time Period, then click Apply.
- Type: Select Inventory Item, Retail Item, Sub Recipe, Menu Item or ALL.
- Inventory Item – Select from the Category Level (if Sub Category is selected then select from the Sub Category dropdown), and Inventory Item dropdowns.
- Retail Item – Select from the Category Level (if Sub Category is selected then select from the Sub Category dropdown) and Retail Item dropdowns.
- Sub Recipe – Select from the Sub Recipe dropdown.
- Click Apply. The below table with the following columns is populated:
- Name: The Name of the purchased inventory item.
- Create Date: The date the Purchase Order was created (DD-MM-YYYY HH:MM:SS format).
- Quantity: The quantity of the purchased item
- Unit Name: The unit set for the inventory item.
- Price: The price of the purchased item. (Price Per Unit set in Vendor section).
- Type: An option from the Type dropdown (Inventory Item, Retail Item, or Sub Recipe).
- Tax: The inventory item tax.
- Total: The value that from the formula Price + Tax.
Consumption Log
High-level
details about consumed inventory.
- Select from the following fields:
- Type: Select Inventory Item, Retail Item, Sub Recipe, Menu Item or ALL.
- Inventory Item – Select from the Category Level (if Sub Category is selected then select from the Sub Category dropdown), and Inventory Item dropdowns.
- Retail Item – Select from the Category Level (if Sub Category is selected then select from the Sub Category dropdown) and Retail Item dropdowns.
- Sub Recipe – Select from the Sub Recipe dropdown.
- Consumption Type: Select System (made systematically during sale), Manual (made during preparation of Menu Item), or ALL (both).
- Click Apply. The below columns appear:
- Consume Date: The business date for the consumption date will be shown.
- Name: Name of the Menu Item. A clickable link which displays a page containing a more detailed consumption history of the item.
- Item Type: An option from the Type dropdown (Inventory, Retail, Menu or Sub Recipe).
- Quantity: The amount of the item consumed by the Store.
- Unit: The unit measure for the Item.
- Note: The columns will be same for all Item Type.
- Item History – Appears when a Name is clicked. The below table containing the following columns is populated:
- Consume Date: The date the item was used.
- Quantity: The amount of the item consumed.
- Unit: The unit of measurement set for the item.
- Reason: The reason for the consumption will be shown along with the sale details.
- Consume Type: Consumption type (system or manual).
- Click the left arrow <- at the upper-left to return to the Consumption Log tab).
Compare Inventory
High-level
details comparing Inventory levels based on activity over a Time Period.
- Select from the following fields along with the Time Period.
- Type: Select Inventory Item, Retail Item, Sub Recipe, Menu Item or ALL.
- Inventory Item – Select from the category Level (if Sub Category is selected then select from the Sub Category dropdown), and Inventory Item dropdowns.
- Sub Recipe – Select from the Sub
Recipe dropdown.
- Click Apply. After a moment to generate the report, the below table with the following columns is populated:
- Name: The name of the Item Type (based on the Type selection).
- SKU Code: The unique assigned code of the Item.
- Beginning
- Quantity: The beginning (before purchase) quantity of the item type.
- Price: The beginning (before purchase) price of the item type.
- Purchase
- Quantity: The amount of the item type that was purchased.
- Price: The purchase price (cost of the purchase item) of the item type and.
- Ideal Used
- Quantity: How effectively the quantity of the chosen item from the filter is used based on the sale.
- Price: The used item’s price details.
- Actual - If an adjustment is made, then its relevant adjusted value and its qty will be shown. The Price will be calculated based on the Quantity.
- Quantity: Current Inventory Count
- Price: The value of the formula = Quantity x Unit Price
- Variance - The range when Quantity is adjusted, between On Hand Quantity and Adjusted Quantity. The Price will be calculated based on the Quantity.
- Quantity: The Difference in Adjusted Quantity
- Price: The value of the formula = Difference in Adjusted Quantity x Unit Price
- Wastage/Restore
- Quantity: How much quantity of the chosen item from the filter is wasted (damaged/expired etc.) based on the time filter.
- Price: The wastage quantities price detail.
- Usage
- Quantity: The overall used quantity of an item based on the time filter.
- Formula = Ideal Used Quantity + Adjusted Quantity
- Price: The usage quantity’s price detail (Ideal Used Quantity Price + Adjusted Quantity Price).
- Transfer In
- Quantity: Then amount of the chosen item was transferred in (received from another store or central warehouse or central kitchen) during the time period.
- Price: The pricing detail of the Transferred Out quantity.
- Transfer Out
- Quantity: Then amount of the chosen item was transferred out (sent to another store or central warehouse or central kitchen) during the time period.
- Price: The pricing detail of the Transferred Out quantity time filter.
- On Hand
- Quantity: The available amount of the chosen item that was on-hand during the time period.
- Formula = Beginning Quantity + Purchase Quantity – Usage Quantity + Transfer In Quantity – Transfer Out Quantity Variance + Variance
- Price: The pricing detail of the available amount during the time period.
- Formula = Beginning Quantity Price + Purchase Quantity Price – Usage Quantity Price + Transfer In Quantity Price – Transfer Out Quantity Price
- Unit: The Inventory Unit of the chosen filters.
- Note: When Inventory Item is chosen in Type filter and when there are different prices configured i.e., for the first 5 item it is configured $5 and for the next following items it is configured as $6 then the price will be listed as $5 for first 5 items then from 6th item on the price will be listed as $6 each.
- When Sub Recipe is chosen as the Type, the last configured Cost Per Price will be listed here.
- The Compare Inventory Report will work based on the Business Date.
- Any negative values will apply to both the Quantity and Price columns.
- Type: The Type of item (an option from the Type dropdown).
Count Sheet
Displays
the inventory and value based on the type of Item and Storage Location.
- Select from the following fields along with Time Period:
- Type: Select Inventory Item, Retail Item, Sub Recipe, Menu Item or ALL.
- If All is selected, then no additional dropdowns appear.
- Inventory Item – Select from the Category Level (if Sub Category is selected then select from the Sub Category dropdown), and Inventory Item dropdowns.
- Retail Item – Select from the Category Level (if Sub Category is selected then select from the Sub Category dropdown) and Retail Item dropdowns.
- Sub Recipe – Select from the Sub Recipe dropdown.
- Storage Location: Select a Location (based on options created under Inventory > Storage Location).
- Click Apply. The below table with the following columns is populated:
- Values may include Items, Sub Recipes and Menu Items from the store depending upon selections.
- Name: The name of the item under the selected Store.
- Vendor Name: The name of the vendor who provided the inventory item.
- Note: There’s no vender for Sub Recipe or Menu Item, so values for those rows will be blank.
- Vendor On Hand: The total Quantity of the Items available from the vendor's inventory items.
- Note: If the Inventory item is created with multiple vendors, each vendor with inventory is displayed as a separate item with its respective quantity.
- Item On Hand: The total quantity of the item purchased from the vendor.
- Unit: Measurement of the Inventory item.
- Cost: The value based on the total On-Hand Quantity of the item.
- Type: The Type of item (an option from the Type dropdown).
COGS
Displays
the inventory and value based on the type of item and storage location.
Select the COGS Type and Time Period. For COGS Type:
- If Products/Items is selected as the COGS Type, select the Type then click Apply:
- If All is selected (Default), no additional dropdowns appear.
- If Menu Item is selected, select from the Menu Item dropdown that appears.
- If Retail Item is selected, select from the Retail Item dropdown that appears.
- If Modifier
is selected, select from the Modifiers dropdown that appears.
The Total Cost appears at the top, with the table containing the following columns below: - Item: The name of the Item.
- Type: The type of Item (an option from the Type dropdown).
- Quantity: The count of the number of items.
- Cost: The cost of the item(s) toward the sale.
- Further down, the Department Total table appears, containing the following columns:
- Name: The name of the Department.
- Cost: The cost for the respective department.
- Percentage: The percentage (%) of the department sold.
- If Inventory is selected as the COGS Type, select the Level (Category or Sub Category) then click Apply. The following tiles then a table containing the following columns appear:
- Total Income (blue tile with a money sack icon) – the Store's total income generated from the inventory.
- Total Cost (pink tile with a dollar ($) sign inside a square icon) – total cost of the inventory.
- Cost Percentage (green tile with a percentage [%] symbol inside a floral icon) – the cost percentage of the inventory.
- Item – The name of the menu item. Click the plus sign (+) next to the name to expand it into an itemized list.
- This items beneath it may have their own plus sign (+)
to expand further. - Unit Price: The price of the item.
- Sold Quantity: The number of the category’s units sold.
- Total Income: The total value (including tax) of the category.
- Cost Per Unit: The cost mapped for the item.
- Total Cost: Total cost of the inventory category.
- Cost %: The value of the formula = (Total Cost / Total Income) x 100.
- Discount: Any discount applied from POS to the menu item.
- Net Revenue: The revenue made from the sale of the item.
- Revenue Cost %: The value of the formula = (Total Cost / Net Revenue) x 100.
Adjust Inventory
Displays
the inventory and value based on the Type of Item and Storage Location.
- Select a Type along with the Time Period.
- Type: Select Inventory Item, Retail Item, Sub Recipe, or ALL.
- If ALL or Sub Recipe are selected, no additional dropdowns appear.
- If Inventory Item is selected, then select from the Category Level (if Sub Category is selected then select from the Sub Category dropdown), and Inventory Item dropdowns.
- If Retail Item is selected, then select from the Category Level (if Sub Category is selected then select from the Sub Category dropdown) and Retail Item dropdowns.
- Reason Type: Select one or more Reason checkboxes from the dropdown (or Select All [default]). These were created under Inventory > Adjust Inventory Reasons.
- Click Apply. The table with the below columns is populated, organized by Reason Types:
- Date: The Date & Time the inventory was adjusted (DD-MM-YYYY 0:00 AM/PM format).
- Item Name: Name of the item which was adjusted.
- Type: The type of item (from the options in the Type dropdown).
- From Quantity: Initial quantity of menu items before adjustment.
- To Quantity: Adjusted quantity of menu items after adjustment.
- Difference: The value of the formula = From Quantity - To Quantity.
- Notes: Any notes entered in the comments during the adjustment of the inventory.
- User Name: The name of the employee who made the adjustment for the Store.
Inventory Item History
Displays fluctuation of the Store's inventory down to the item level.
- Select a Type (followed by either Inventory Item or Retail Item based on selection) and Time Period.
- Inventory Item – Select from the Inventory Item dropdown.
- Retail Item – Select from the Retail Item dropdown.
- Click Apply. The below table with the following columns is populated:
- Inventory Item: The name of the item.
- Date: The Date & Time the inventory was updated (DD-MM YYYY HH:MM AM/PM format).
- Name: The Name of the item.
- SKU Code: The unique code assigned to the item.
- Type: The type of item (Inventory or Retail).
- Event: The event that occurred for the inventory (Modify, Created, Adjusted, Restored).
- Log: The amount of change to inventory item (such as Quantity or Price Per Unit).
- User Name: The User ID of the device from where the sale was made.
- Inventory Item Details: When an Inventory Item name is clicked, a screen displaying the below table with the following columns appears:
- Inventory Item: The selected Inventory Item.
- Item Type: The type of item (from the options in the Type dropdown).
- SKU Code: The item’s assigned unique code when created, if applicable.
- Date: The date of the event performed on the item (MM-DD-YYYY HH:MM AM/PM format).
- Event: The activity (Modify, Created, Adjusted, Restored) that was performed on the item's inventory.
- Log: The value of the adjustment(s) to the inventory item (such as Quantity or Price Per Unit).
- Username: The employee who performed the adjustment on the Store item's inventory.
- Click the left-facing arrow <- at the upper-left to return to the main Inventory Item History tab.
Matrix Report
Displays high-level sales inventory activity based on Categories and/or Sub Categories.
- Select a Level (followed by Category / Sub Category) and Time Period.
- If Category is selected, then select from the Category dropdown that appears.
- If Sub Category is selected, then select from the Sub Category dropdown that appears.
- If ALL is chosen, no additional dropdowns appear.
- Click Apply. The table with the following columns is populated:
- Item – The name of the menu item.
- Sold Quantity – The amount that the menu item sold.
- Popularity – The percentage (%) of the individual item’s sales vs the total sold quantity.
- Avg. Cost/Unit – The average cost of each produced unit. Understanding this is essential to ensure your business remains profitable.
- Formula = Total Cost / Sold Quantity
- Sale Price/Unit – The value of the formula = Sales / Quantity Sold.
- Profit/Unit – The amount of Profit per sold Unit. Profit is the revenue remaining after all costs are paid.
- Formula = (Selling Price - Discount - Inclusive Tax - Total Cost) / Sold Quantity
- Total Cost – The sum of cost of all items.
- Total Revenue – The store’s total income from the formula = Selling Price – Discount – Inclusive Tax
- Total Profit – The value of the formula = Selling Price – Discount – Inclusive Tax – Total Cost
- Profit Category and Popularity Category – 2 levels (High or Low - based on the Threshold value configured in Settings).
- Menu Item Class – 4 classes based on a category’s profitability and popularity:
- Stars: High Profitability and high popularity.
- Plow Horse: Low Profitability and High Popularity (costly to make).
- Puzzles: High Profitability and Low Popularity (difficult to sell).
- Dogs: Low Profitability and Low Popularity (costly to make and low popularity).
Wastage Report
Displays wastage activity of the Store's inventory, such as items that were voided, sold after their expiration date, or even not ever used.
- Select a Type and Time Period.
- Type – Select one of the following:
- Sale Void – Menu Items which were voided after being prepared.
- Manual – Menu Items manually voided when adjusting inventory.
- Purchase Expired – Menu Item purchased after the expiration date.
- Item Yield – Menu Item of which a portion was not used.
- Click Apply. The below table with the following columns is populated:
- Date: The Date & Time the wastage was adjusted (DD-MM-YYYY HH:MM AM/PM format).
- Item Name: The Name of the menu item moved to wastage.
- Item Type: The type of item wasted (Menu Item or Sub Recipe) should be displayed.
- Wastage Type: Adjustment type (Purchase Expired, Sale Void, Item Yield, or Manual).
- SKU Code: The unique code assigned to the item when created.
- Quantity: The amount of this menu item's SKU that was wasted.
- Cost Per Unit: The cost of a single unit of the SKU.
- Cost: The value of the formula = Quantity x Cost Per Unit.
Related Articles
Reatil Back Office: Inventory Reports
Navigation: Log into the Back Office for your Retail Store, then select Reports > Inventory Reports. The Inventory Reports page is organized into multiple tabs: Master Stock Purchased Item Consumption Log Compare Inventory Count Sheet COGS Adjust ...Back Office: Inventory - Purchases
Navigation: Sign into the Back Office. On the left-side, click Inventory then Purchases. The Purchases page appears, with options for Purchase Templates, Purchase Orders, Purchase Invoices, Received Items, or Expired Purchase Item. Purchase Templates ...Back Office: Enterprise - Sync Inventory
Sign into the Back Office. On the left-side Navigation Panel, click Enterprise. On the Enterprise page, click Central Inventory then select Sync Inventory. The Sync Inventory page appears, which highlights the benefits that come with a fully synced ...Back Office: Store Inventory Settings
Navigation: Sign into the Back Office for your Store. On the left side, click Settings. On the Settings page, under Inventory, select Store Inventory. On the Store Inventory screen: at the top is a listing of the reports utilizing the Business Date ...Retail Back Office: Exchange Reports
Navigation: Log in to the Back Office for your Retail Store, then select Reports > Exchange The Exchange Report page that appears will display Today's data by default, but you can select a Time Period from the dropdown and select any Date(s) if ...