Retail Back Office: Customer Preference Report
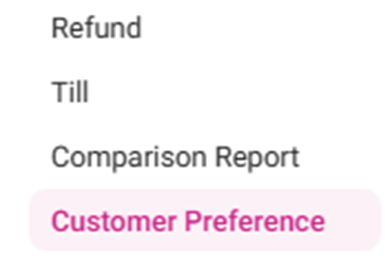
Navigation: Sign into the Back Office for your Retail Store, then select Reports > Customer Preference.
Customer Preference
Displays Customer Ordering Activity. Filter by Employee, Settings, and Time Period then click Apply.
- Employee: Select an Employee’s name (of the list of employees who set the till) from the dropdown (or All).
- You can Search to find the employee more quickly.
- Include Settings: Select Category, Subcategory, Serving Size, or All.
Customer Preference Table
When Apply is clicked, the below columns are displayed:
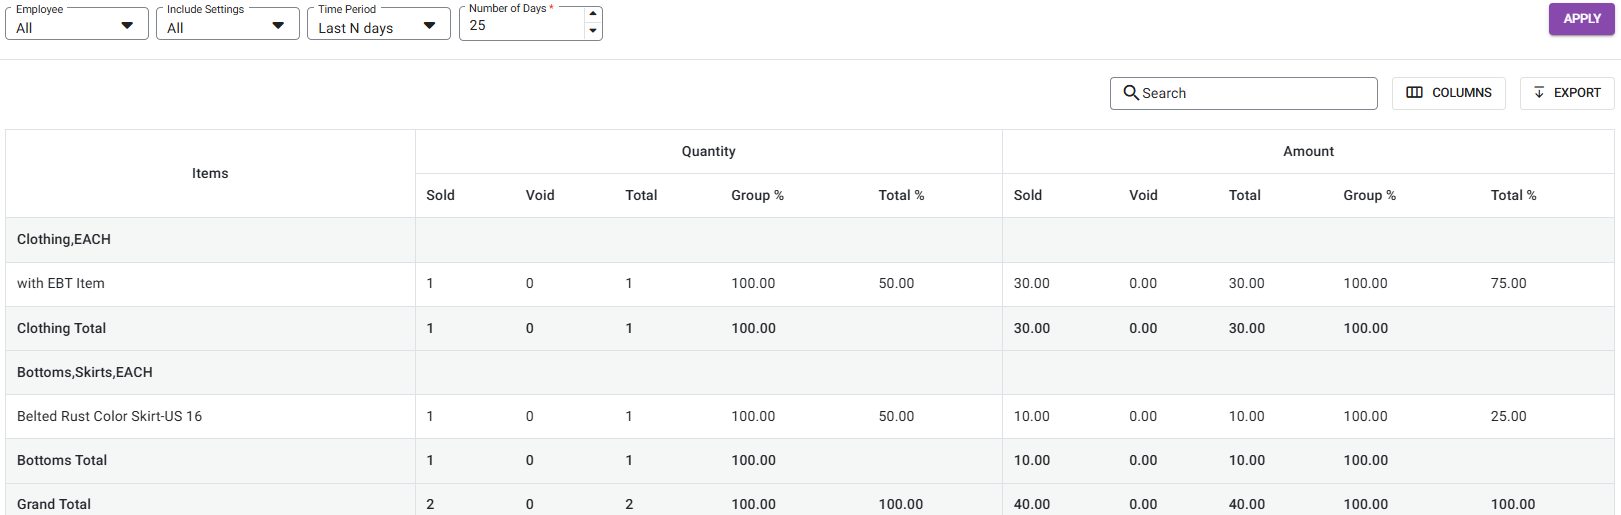
- Items: The item’s category, subcategory and serving size.
- Quantity: Sub headers for amounts Sold (quantity), Void (quantity), Total (Sold Quantity + Void Quantity), Group % and Total %.
- Amount: Sub headers of the amounts Sold (in currency), Void (in currency), Total (Sold Amount + Void Amount), Group % (Item Total / Group Total) and Total % (Item Total / Grand Total [at the very bottom]).
- The overall Total appears for the Quantity and Amount of each Category, Sub-Category and Serving Size.
- The Grand Total appears at the very bottom of the table for all columns.
- Note: The organization of the table will be broken down by the Items column depending upon the Include Settings selections:
- Example: When Select All (Category, Sub Category and Serving Size) is selected
- Example: When just Category is selected
- Example: When Sub Category and Serving Size are selected