Retail Back Office: Enterprise - Reports
Navigation: Sign
into the Back Office. On the left-side Navigation Panel, click Enterprise. Select Enterprise Reports, and the dropdown contains options to access specific reporting Dashboards:
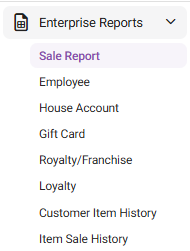
Enterprise Reports
Sale Report
The
Sale Report dashboard contains reporting of sales broken down by the
name of each tab: Enterprise Report, Departments, Categories, Sub Categories,
Retail Items, Hourly Sales, Daily Sales, Sale
Recap (most recent business day), Cashier Out (most recent business
day), Weekly Summary, Sale Summary, and Enterprise Detailed Report
(can only be viewed via Export to Email).
- Each reporting tab allows for filtering by various settings - including individual Stores, Departments, Categories, Sub Categories, Retail Items, etc. and to narrow the results by various Time Periods.
- Most reports include graphs representing Top Sales, Sales By Hour, and a more detailed table view of the data that allows for exporting.
- If a Split By… box is selected before Apply is clicked, more detailed information will be displayed – broken down by the identified value in the field. The below example is Split By MenuItem from the Categories tab.
- For the Enterprise Report tab: if a Store Name is selected:
- A drilldown table for that Store appears, with a more detailed breakdown of the column totals, based on the Time Period.
- For the Sub Categories tab: if the Detailed View box is selected before Apply is clicked, it provides a more detailed breakdown of each listed Sub Category result.
- On the Hourly Sale tab: if a + sign is clicked next to a Time, it’s expanded to show the sales during that hour, broken down by Server. Click the Time again to collapse the row and show the + again.
Employee
The
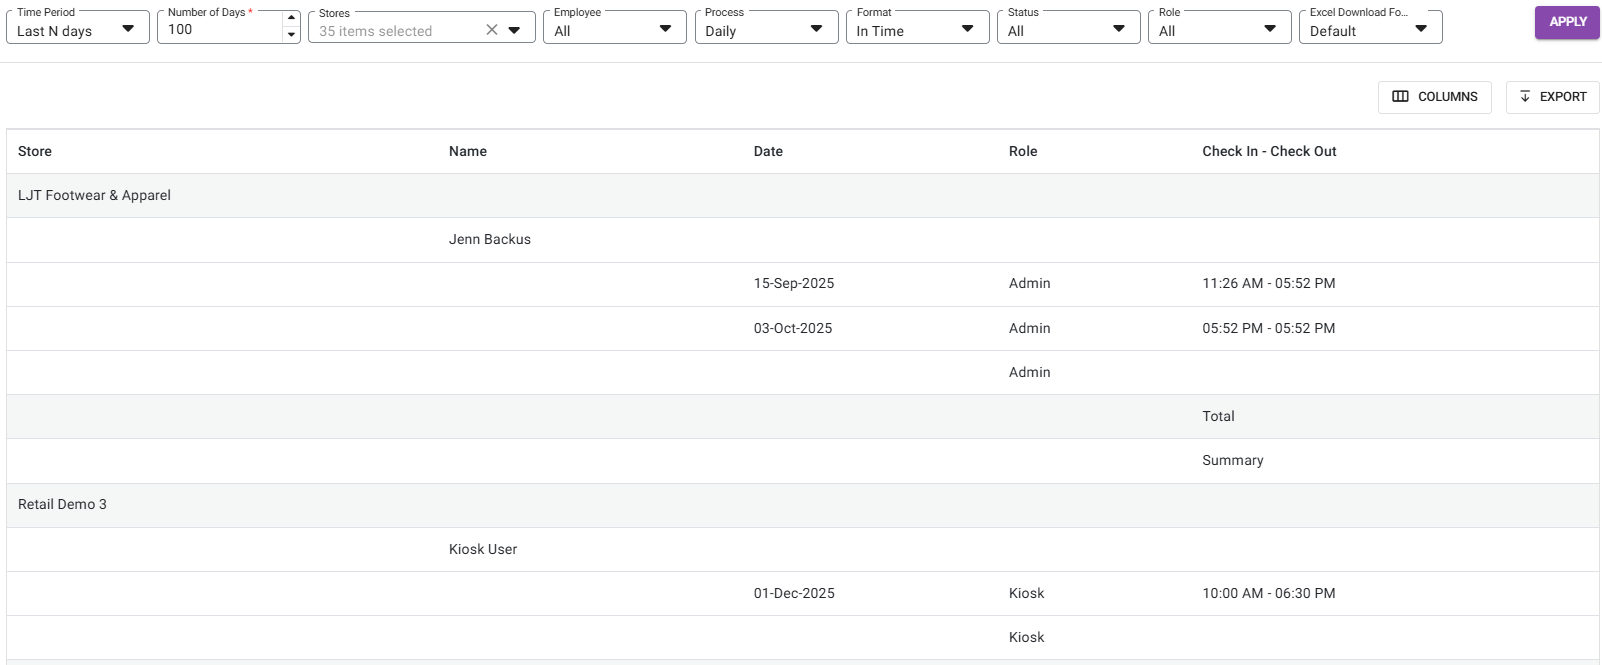
Employee Reports dashboard contains the Enterprise Payroll Report tab, where you can
view an overview of the payroll. The report can be broken down by Time
Period, Store(s), Employee, Process (recurring), Format,
Status and Role. Also, you can select the formatting of the Excel
file to download.
After clicking Apply, the table displays Payroll information broken down by the store(s) selected in the Stores dropdown.
House Account
House Accounts allow customers to have an Account with a Retail Store (like a Gift Card) but functions like a Credit Card, where there is a limit and a balance. The House Account Enterprise Report page contains the following tabs:
HA Activity | HA Statement |
The HA Activity tab contains the following filters:
| The HA Statement tab contains the following filters:
|
Gift Card
The Gift Card Enterprise Reporting page contains the Redemption tab which provides information on Gift Card redemption.
Select from the following filters: Stores, Card Number, and Activity Type (In-Store or Online) and a Time Period. You can also select the Group by Store box to organize the results by each Store.
When ready, click Apply to populate the below table containing the following columns:
If Group by Store is selected:
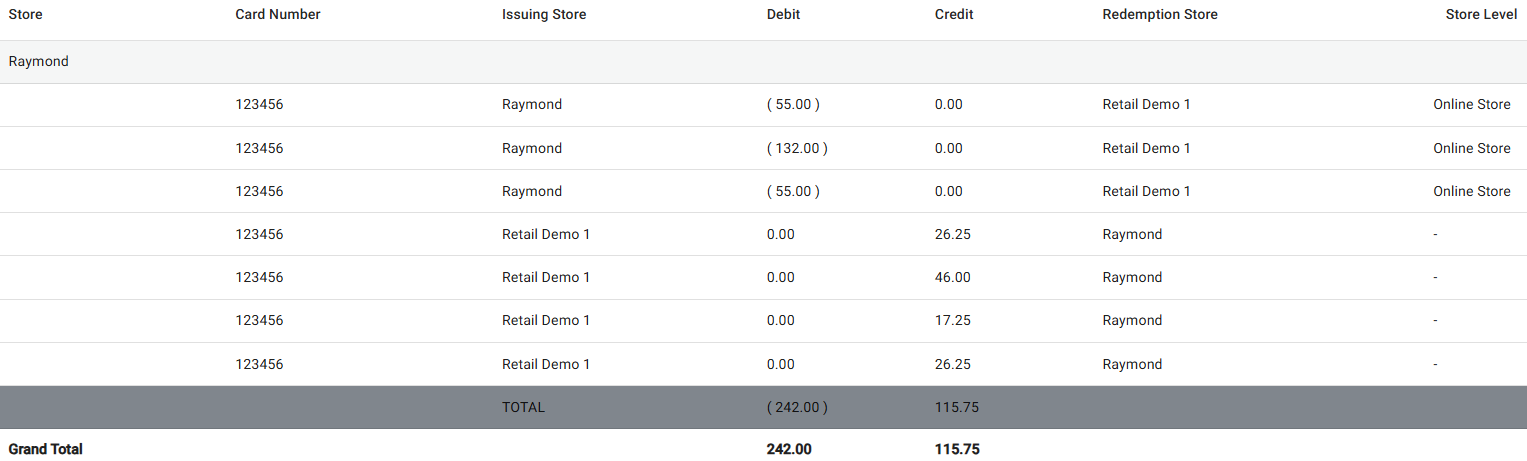
- Store: Store name will appear.
- Card Number: Card Number will appear.
- Issuing Store: It is the master store that issued [sold] the gift card.
- Debit: Debit amount will appear.
- Credit: Credit amount will appear.
- Redemption Store: The store at which the issued card is redeemed for the sales made.
- Store Level: Store level will appear.
- Total: At the end of each store, a summary should be included to show the Total (Total for each store).
- Grand Total: Sum of Debit and Credit amount.
If Group by Store isn't selected:
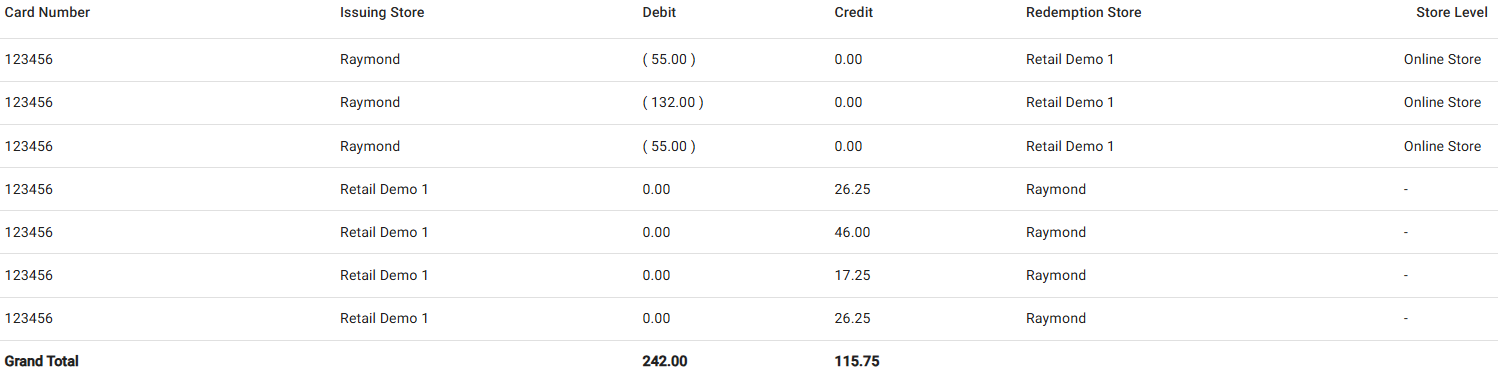
- Card Number: Card Number will appear.
- Issuing Store: It is the master store that issued [sold] the gift card.
- Debit: Debit amount will appear.
- Credit: Credit amount will appear.
- Redemption Store: The store at which the issued card is redeemed for the sales made.
- Store Level: Store level will appear.
- Grand Total: Sum of Debit and Credit amount.
Royalty/Franchise
- Royalty – Contains sale information about paying out Royalties. The data is broken down by Store, with information on the Sales Subjected to Royalties, and the Royalty Fees.
- Select from the following fields and Time Period.
- Filter Stores By – Select from the dropdown.
- Selected Stores – Select one or more options based on the Filter Stores By selection (click Select All to Select/Deselect all options).
- Selected Discounts – Select one or more options based on the Filter Stores By selection (click Select All to Select/Deselect all options).
- Exclude Loyalty Redemption – If selected, Loyalty Points will not be included. If deselected (default) they will be included.
- Click Apply. A table with the below columns appears, displaying values based on your selections:
- Store Name: The name of the Store.
- Business Date: The Date the Royalty Fee was applied.
- Net Sales: The Net Sale value (up to 2 decimal points).
- Net Sale = Gross Sale - Tax - Discount - Discount Tax - Void - Void Discount Tax
- Chargeable Discounts: Any Chargeable Discount amount from the Sale Recap Report.
- Loyalty Redemption: Any Loyalty Redemption amount from the Sale Recap Report
- Royalty Subjected Amount: The Royalty Subjected amount based on the following:
- If the Exclude Loyalty Redemption box is selected, the formula will be: Royalty Amount = (Net Sale - Loyalty Redemption + Chargeable Discount).
- If deselected, the formula will be: Royalty Amount = (Net Sale + Chargeable Discount).
- Gift Card Sold: Total amount of all sold gift cards.
- Gift Card Redeemed: Total amount of all redeemed gift cards.
- Royalty Fee: The value based on the formula Royalty Subjected Amount x Royalty Percentage.
- Total Due: The total amount due for the specific Store / Group / City / State / ZIP Code.
- Formula = Royalty Amount + GC Sold - GC Redeemed
- ACH Report – Contains sale information about ACH Transactions and Royalties.
- Select from the following fields and Time Period.
- Filter Stores By – Select from the dropdown.
- Selected [Options] – Select one or more options based on the Filter Stores By selection (click Select All to Select/Deselect all options).
- Selected Discounts – Select one or more options based on the Filter Stores By selection (click Select All to Select/Deselect all options).
- Credit Entry Class – Select PPD or CCD for the type of transaction.
- PPD (Prearranged Payment and Deposit): ACH transactions that involve a consumer account
- CCD (Corporate Credit or Debit): ACH transactions between businesses or other organizations
- Credit/Debit – Select to display Credit or Debit transactions (or Both).
- Exclude Loyalty Redemption – If selected, Loyalty Points will not be included. If deselected (default) they will be included.
- Click Apply. A table with the below columns appears, displaying values based on your selections:
- Store Name: The name of the Store.
- Business Date: The Date the Royalty Fee was applied.
- Net Sales: The Net Sale value (including up to 2 decimal points).
- Net Sale = Gross Sale - Tax - Discount - Discount Tax - Void - Void Discount Tax
- Discount: The total value of applied Discounts (negative value, up to 2 decimal points).
- Bank: The name of the Bank.
- Fees %: The percentage applied for Fees.
- Royalty Fees: The value from the formula Royalty Subjected Amount x Royalty Percentage.
- Total: The total in Royalty Fees.
- Download ACH Transaction File – Click the button at the upper-right to download the file. It contains the following information about ACH Transactions: Destination name, Destination Routing Number, Immediate Origin Name, Immediate Origin Number, Company Name, Company Entry Description, Company Discretionary Data, Company Identification Number, Originating DFI Identification.
Loyalty
Contains information on Loyalty Point accrual and redemption. The data is broken down by Customer, with information on their Total Accumulated and Redeemed Points, and their Current Available Points.
Select a Customer Name (or All) and a Time Period, then click Apply. The below table containing the following columns is populated:
- Customer Name: The name of the Customer.
- Sign Up Date: The date the Customer signed up for a Loyalty Account.
- Last Redemption Date: The most recent date that Loyalty Points were redeemed.
- Last Accumulated Date: The most recent date that Loyalty Points were accumulated.
- Total Accumulated Points: The sum of all accumulated Loyalty Points.
- Total Redeemed Loyalty Points: The sum of all redeemed Loyalty Points.
- Current Available Points: The current amount of available Loyalty Points.
- Click a Customer Name to view a table displaying a breakdown of their Loyalty Point accrual by transaction, containing the following columns:
- Date: The Date of the receipt.
- Receipt Number: The Receipt Number.
- Event: The type of Event.
- Points Adjusted: The amount of points for the adjustment.
- Adjusted by/Adjusted Reason: The name of the Employee who performed the adjustment, and the reason they provided.
- Loyalty Reward: The customer's balance of Loyalty Reward Points.
Customer Item History
- This report includes a customer’s details, such as: Sale (Menu Item, Modifiers), Void, Store Credit, Gift Card, Refund, Open Item, and Open Modifier. It also includes filters such as Filter Stores By, Customer Name and Time Period. The Apply option will be available.
- Columns on the Report:
- Date - Displays the Business Date of the Sale.
- Check No (Receipt if Retail Store/Account) - Displays the Check/Receipt Number
- SKU/Barcode - Displays the SKU/Barcode.
- Description - Shows the item details of the Customer such as Sale (Menu Item, Modifiers), Void, Store Credit (Redeem and Balance), Gift Card (Redeem and Balance), Refund, Open Item, and Open Modifier.
- Quantity - Displays the Quantity of the Sale. If it is scale item, then the measure type will appear.
- Net Sale - Displays the Price of the Menu Item. Only the Price of the Menu Item will appear in the Net Sale column and if the menu item has inclusive tax, then it should be included. Price (net sale) and Discount is calculated for an item, and it will be multiplied by the Quantity in order to match the Total.
- Discount - Displays the discount for the sale.
- Total - Displays the overall Total. Also, the Total Row will be available for the Quantity, Net Sale, Discount and Total columns.
Notes:
- The data will be gathered from POS, OLO, Call Center, Kiosk, VRT, and Custom App.
- Customers will appear in the Customer filter based on the selection made in the Filter Stores By dropdown.
Item Sale History
This report includes filters such as Filter Stores By, Item Name (Menu/Retail) and Time Period, then click Apply to apply the filter selections.
Table Columns:
- Item Name – The name of the item appears at the top of the table.
- Transaction Date – The selected transaction date (sale business date).
- Receipt Number – The unique receipt number.
- Customer Name – The name of the customer who purchased the selected item. If no customer is linked to the sale, then N/A appears.
- Quantity Purchased – The quantity of the item that was purchased.
Note:
- The data will be gathered from POS, OLO, Call Center, Kiosk, VRT, and Custom App.
- Items will appear in the Item filter based on selections made in the Filter Stores By dropdown.
Export a Report
- Click Export. The Export pane appears.
- On the Export pane: select the export file's Format and Delivery Option then click Export at the bottom-right.
- If Send by Email, the Email field appears. Enter the Email Address the report should be sent to.
- The file will be downloaded (to the assigned folder on your computer) or emailed to the entered Email Address.
- Open the Export to view all the info within one file.
- Example: XLSX file
Related Articles
Back Office: Enterprise - Reports
Sign into the Back Office. On the left-side Navigation Panel, click Enterprise. Then click Enterprise Reports. Under Enterprise Reports are options to access specific reporting Dashboards: Enterprise Reports Sale Report The Sale Report dashboard ...Retail Back Office: Enterprise - Sync Inventory
Navigation: Sign into the Back Office. On the left-side Navigation Panel, click Enterprise. On the Enterprise page, click Central Inventory then select Sync Inventory. The Sync Inventory page appears, which highlights the benefits that come with a ...Retail POS: Membership Payments
Membership gives the ability to organize Customers into Loyal Customers. By using Membership Account, you will be able to organize and apply Tax exemptions to Members of the group, maintain the account balance, and issue allowances. Membership ...Retail Back Office: Enterprise Stores
Navigation: Sign into the Back Office for your Retail Store. On the left-side Navigation Panel, click Stores. The Stores page appears, with each tile representing a Store under your Enterprise. Click on a Store's tile to access its Back Office. Note: ...Retail Back Office: Membership Reports
Navigation: Log into the Back Office for your Retail Store, then select Reports > Membership. The Membership report page contains the following tab options: Membership Summary Membership Statement Membership Summary Displays the details of a ...